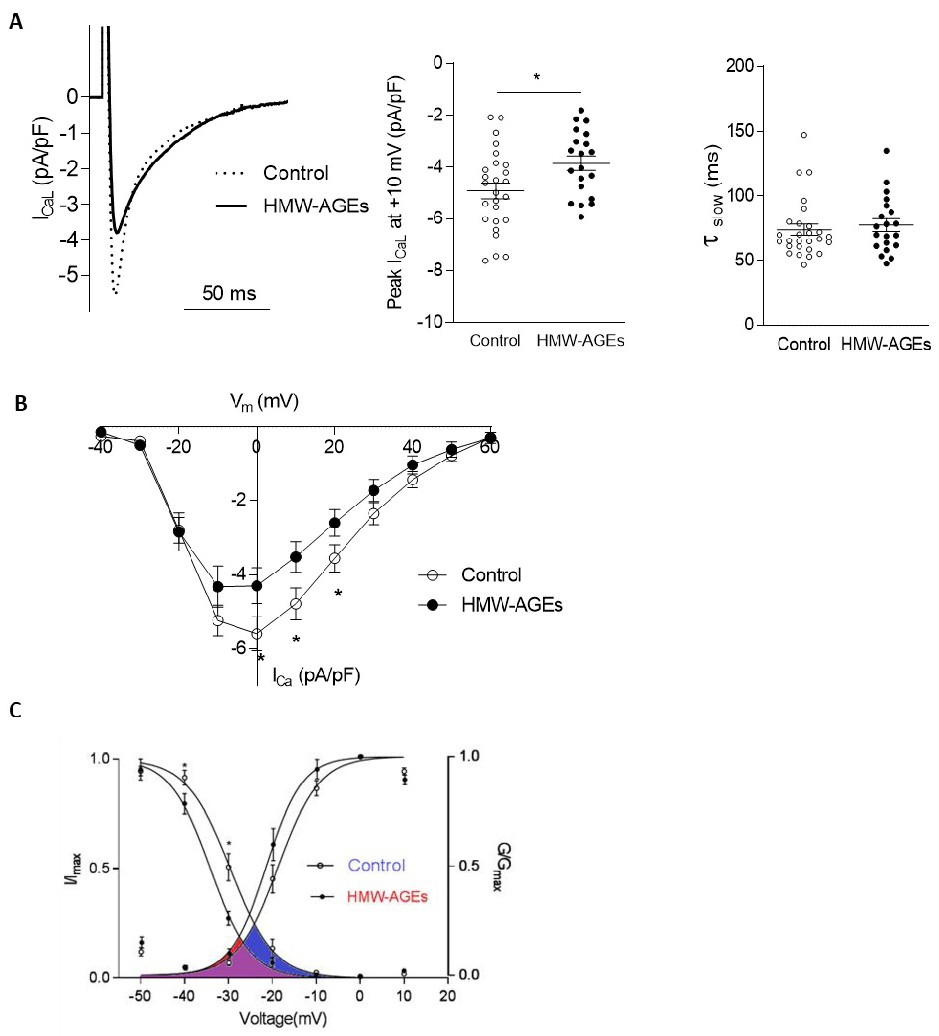
Fig. 4. L-type Ca2+ current density is reduced with HMW-AGEs injections. (A) Representative example of L-type Ca2+ current (ICaL, pA/pF) density elicited by a depolarizing step from -40 mv to +10 mV in control and HMW-AGEs group (left panel). Peak ICaL normalized to cell capacitance (pA/pF) in cardiomyocytes derived from control (ncells=26) and HMW-AGEs-injected (ncells=20) animals (mid panel). Data are shown as mean ± SEM. * denotes P<0.05 vs control (p=0.016, parametric unpaired t-test). Slow time (τslow, ms) constant in cardiomyocytes from control (ncells=27) and HMW-AGEs (ncells=20) animals (right panel). Data are expressed as mean ± SEM (p=0.5016, parametric unpaired t-test). (B) Voltage-dependence of ICaL (mV) in cardiomyocytes from control (ncells=18) and HMW-AGEs (ncells=12) animals. Data are expressed as mean ± SEM. * denotes p<0.05 vs control (2-way ANOVA followed by Tukey's post hoc test. (at 0 mV p=0.0364, at 10 mV p=0.0238, at 20 mV 0.0438) (C) Steady-state activation and inactivation of ICaL in control (ncells=12) cardiomyocytes (blue) and in HMW-AGEs (ncells=8) derived cardiomyocytes (red). Amplitudes of the peak inward current during the test pulse (I) were normalized to their respective maximum value (Imax) and are plotted as a function of the inactivating potential. Amplitudes of channel conductance during the test pulse (G) were normalized to their respective maximum value (Gmax) and are plotted as a function of the activating potential. The activation window is indicated in color; blue for the control animals, red for the animals subjected to HMW-AGEs injection and violet for the overlap between both groups. Data are expressed as mean ± SEM. * denotes p<0.05 vs control.